Friday, February 22, 2019

Perimeter and Area

Perimeter and Area

Image result for area

We are working on perimeter and area. We have focused quite a bit on the formulas that are used to find both. In fact, your kiddo might have come home talking about the 3 good Fs in math. This is a saying that we use to help us remember to use the formula when finding perimeter and area.

Find the formula and write it down.
Fill in the formula with the correct measurements.
Find the answer and label the unit.

Image result for perimeter

Perimeter is the distance around a two-dimensional shape.

We focused on three formulas to find perimeter:

P = s + s + s (perimeter = side + side + side) - this formula can be used on any shape


P = 4 x s (perimeter = 4 x side) - this formula works for squares

Image result for perimeter of a square

P = (2 x l) + (2 x w) or P = 2(l +w); perimeter = (2 x length) + (2 x width) - this formula works for rectangles


Image result for area

Area is the size of a surface or the amount of space inside the boundary of a flat (2-dimensional) object.

We focused on one formula to find the area of a rectangle:

A = l x w (area = length x width)

Image result for area of a rectangle

Follow this link if you want more clarification on calculating perimeter and area:

Calculating Perimeter and Area

Here are a couple of songs we listened to in class:

Cat Perimeter and Area Song

Perimeter and Area Song

Here are some games that you can play to practice these skills.

Math Playground Area and Perimeter

Zoo Designer

Perim-Bots

Area Shape Game

Chicken Corral

Knights of Area and Perimeter

Please let me know if you have any questions.

Tuesday, February 12, 2019

Weathering, Erosion, and Deposition

Weathering, Erosion, and Deposition


Related image

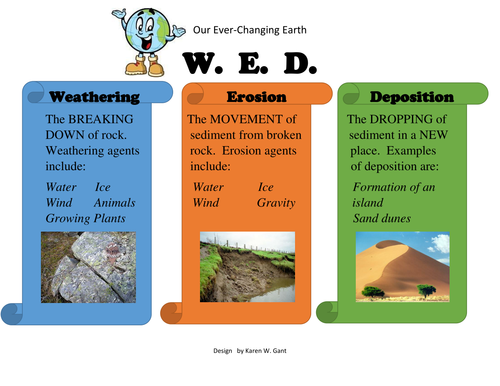
We are studying the slow changes to the Earth's surface. These processes include weathering, erosion, and deposition.
Related image

Weathering is the process of natural forces breaking down rocks into smaller pieces. Some of the causes of weathering include: moving water, ice, wind, plant root growth, burrowing animals, and temperature changes.

Image result for weathering

Erosion is the process which the broken pieces are transported, or moved, from one place to another. Some of the causes of erosion include: moving water, wind, glaciers (ice), and gravity (avalanches).

Image result for erosion

Image result for weathering erosion and deposition

Deposition is the process of moved particles being deposited, or dropped off, in a new location. This process creates new land forms such as flood plains, deltas, sand dunes, and beaches.

Related image

Although we talk about weathering, erosion, and deposition as three separate processes, they often occur together. Over time, rocks are generally broken into smaller pieces (weathering), carried downhill (erosion), and deposited in a new location (deposition).
Image result for weathering erosion and deposition

Image result for weathering erosion and deposition
Here are some games to help further your understanding of WED:

WED Jeopardy

Shape It Up

Data Representations

Data Representations

Image result for data
We have been learning about three new ways to represent data. We have learned about dot plots, frequency tables, and stem-and-leaf plots.

dot plot is a graphical display of data using dots. It is very similar to pictographs.


Related image

frequency table is a table that shows a set of numbers/scores and their frequency (how many times each one occurs).


Frequency Distribution

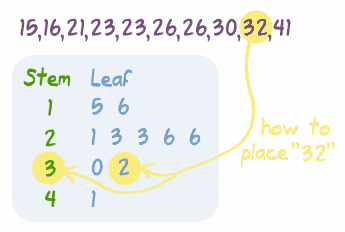
stem-and-leaf plot is a plot where each data value is split into a "leaf" (usually the last digit) and a "stem" (the other digits). For example "32" is split into "3" (stem) and "2" (leaf). The "stem" values are listed down, and the "leaf" values are listed next to them. This way the "stem" groups the scores and each "leaf" indicates a score within that group.


Stem-and-Leaf Plot

Here are the basic steps to creating a stem-and-leaf plot:

Here are some videos about these data representations:


Here are some activities that you can do to practice these skills:


Please let me know if you have any questions!

Friday, February 1, 2019

Ordering Fractions

Ordering Fractions


When ordering fractions you use the same strategies as you do when comparing fractions. You just add a few more fractions to compare. :)

Image result for ordering  fractions

Draw a picture. This strategy can work with smaller fractions, but starts to get complicated with larger fractions. It is also a strategy that can lead to many mistakes, so we have to be very careful with it.

Image result for ordering  fractions


Compare with like denominators. When the denominators are the same, you are comparing the numerator. The larger numerator will be the larger fraction.

Image result for compare fractions with like denominators anchor chart


Compare with like numerators. When the numerators are the same, you are comparing the denominator. The larger the denominator, the smaller the pieces will be. Therefore, the smaller denominator will give you the larger fraction.

Image result for ordering  fractions


Compare to a benchmark fraction like 1/2. Determine how the fraction relates to ½ and that can help determine the larger or smaller fractions. We have also put them on a number line to help us clearly see how they compare.

Image result for ordering  fractions


Compare missing pieces. The fraction with the smallest piece missing will be the largest fraction.

Image result for ordering fractions by comparing the missing piece


Change all denominators to a common denominator. This allows kiddos to then compare fractions with like denominators.
Image result for ordering fractions by finding a common numeratorImage result for ordering  fractions

Here is a video that show some of these strategies:

Comparing and Ordering Fractions

Follow these links for ways to practice this skill:

Ordering Fractions Practice

Order Fractions

Drag to Order Fractions

Please let me know if you have any questions.

Converting Customary Units of Measurement

Converting Customary Units of Measurement We have been working on converting Customary Units of measurement in Math. In problems...